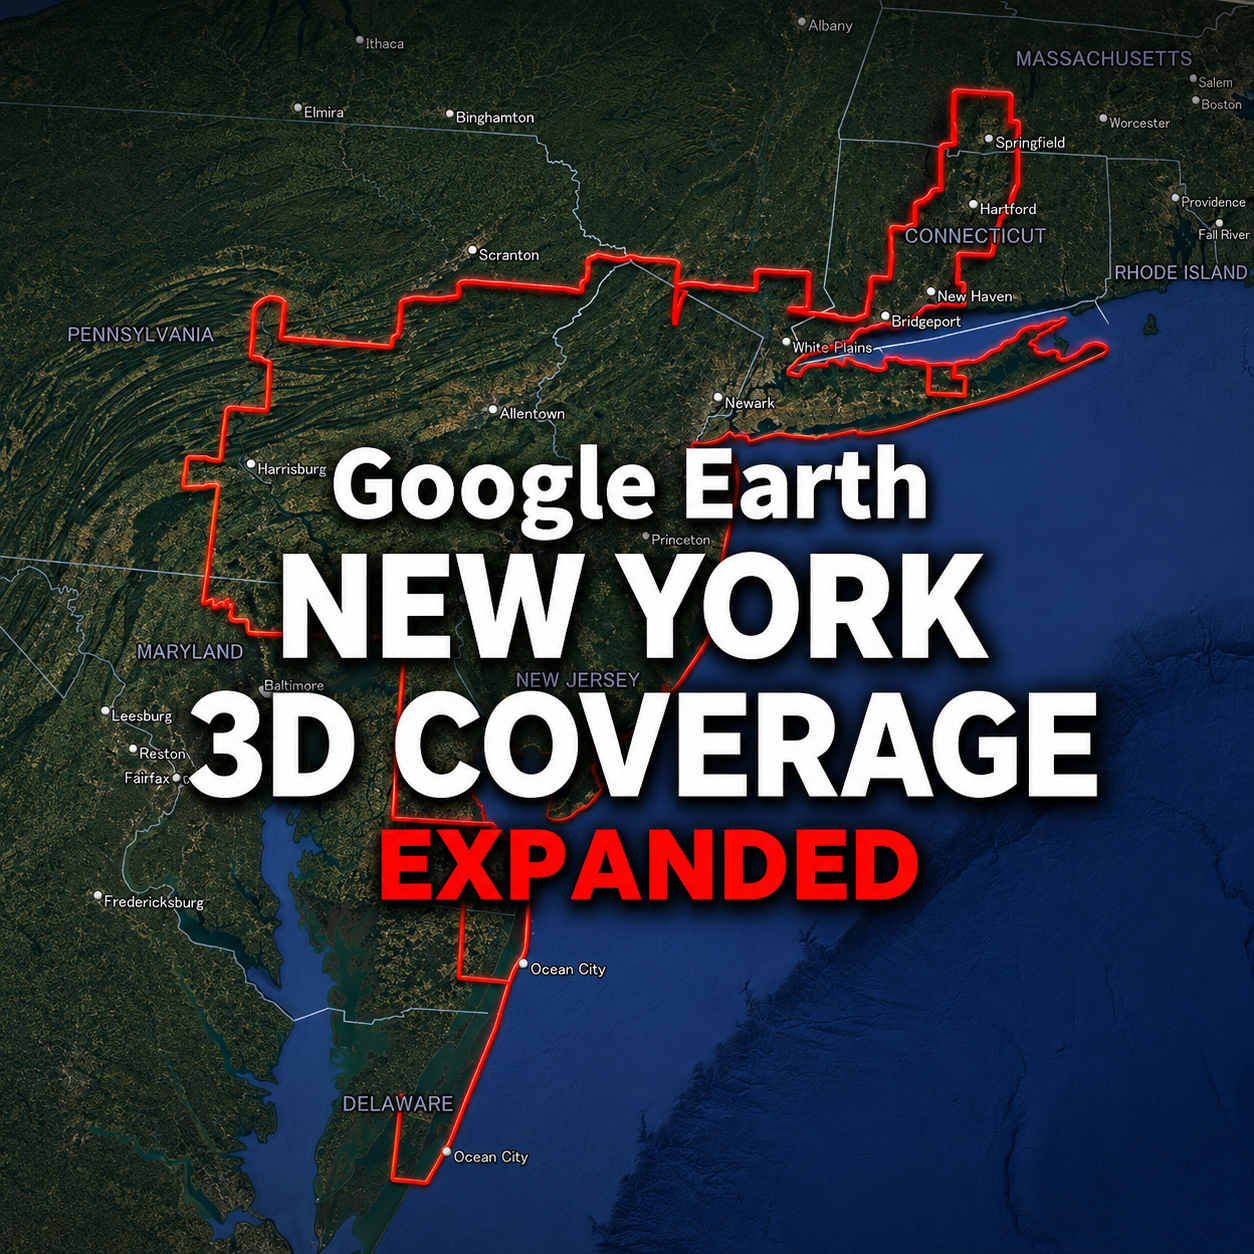
Google Earth’s photorealistic 3D coverage around New York has expanded significantly.
A comparison of boundary data manually traced on March 4 and July 30, 2026, shows that the continuous 3D coverage footprint increased by approximately 5,945 km²—a growth of about 10.6% in less than five months.
The largest change extends southward through Delaware and into the Delmarva Peninsula. Another substantial area has been added across southern New Jersey.
Several patch-like 2D gaps inside the previously mapped region also appear to have been filled.
However, not every gap disappeared.
A conspicuous 2D area remains around Manorville in central Suffolk County on Long Island, even though several similar gaps elsewhere have now become available in photorealistic 3D.
In this article, we compare the March and July boundaries, measure the expansion using the actual KMZ geometry, and examine both the newly added areas and the remaining 2D gap.
Google Earth 3D Coverage Around New York Has Expanded
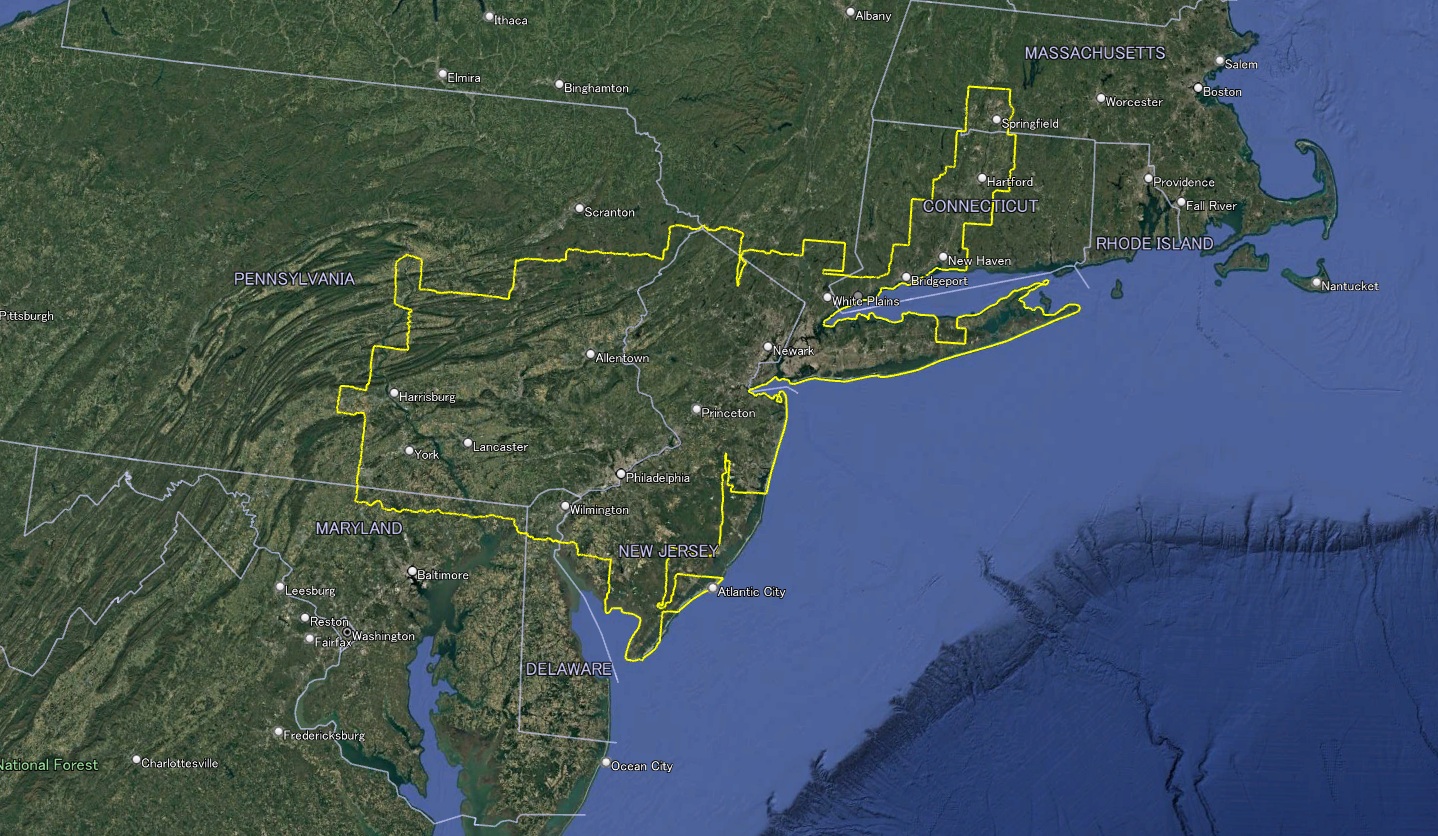
Southern New Jersey 3D coverage confirmed on March 4, 2026. A large gap remained between the inland boundary and the Atlantic coast.
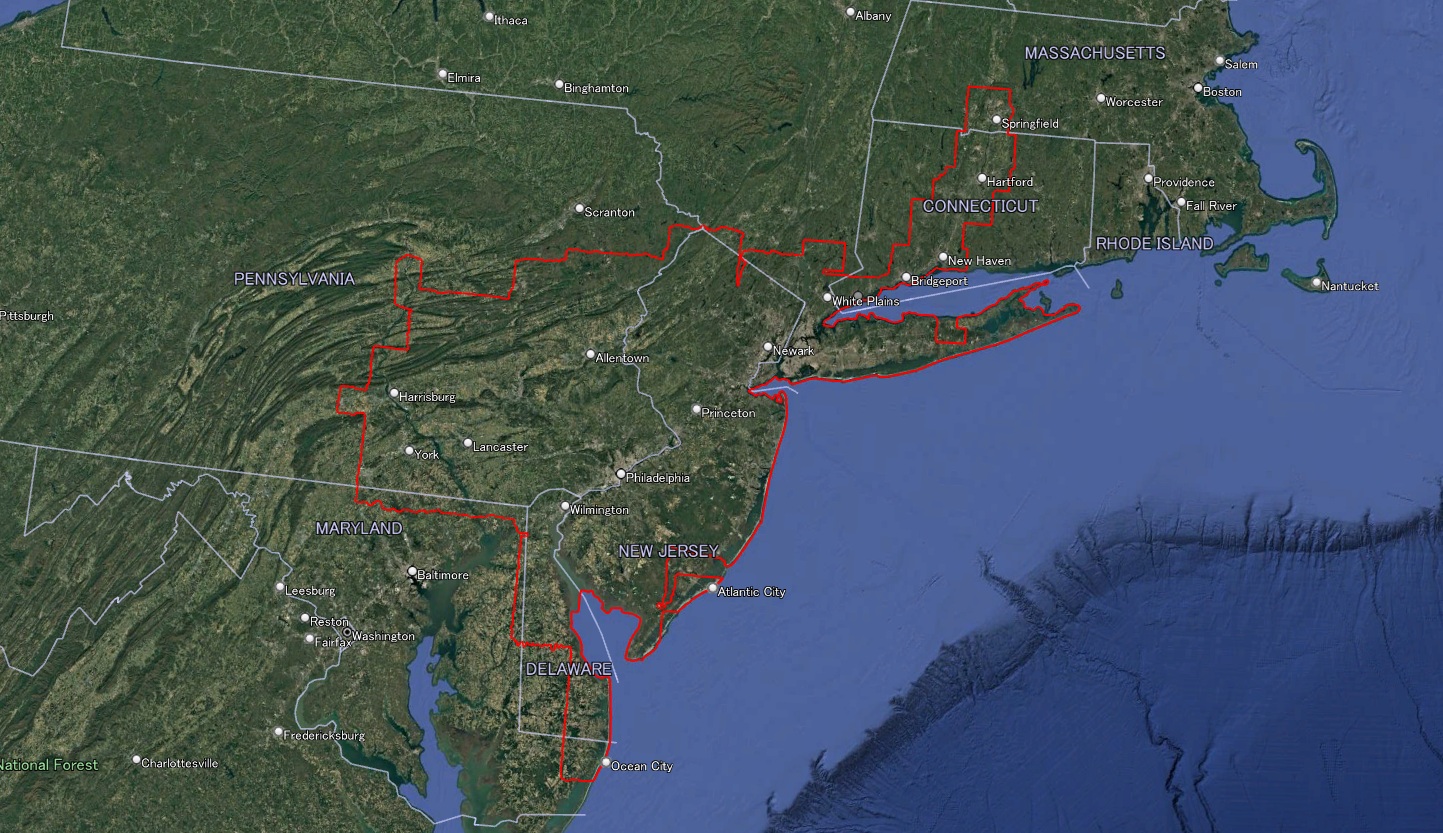
Southern New Jersey 3D coverage confirmed on July 30, 2026. Much of the previous coastal gap is now included.
Until recently, the latest boundary survey published by Global Map Insights was based on observations made on March 4, 2026.
When we checked the region again on July 30, 2026, the outer boundary had changed substantially.
The update was not limited to New York City or its immediate suburbs.
The already enormous continuous 3D region had expanded farther south, connecting additional areas of southern New Jersey, Delaware and the Delmarva Peninsula to the existing coverage.
This means that what we commonly call the “New York 3D coverage area” is no longer simply a collection of 3D cities around New York.
It is now a vast continuous region extending across several states in the northeastern United States.
Important: July 30, 2026 is the date on which we confirmed the change. Google does not publish an exact Google Earth update date for each individual area, so the date when the new 3D imagery became available is unknown.
Before-and-After Comparison: March 4 vs. July 30, 2026
The comparison is based on two independently traced KMZ boundary files.
- Before: Boundary confirmed on March 4, 2026
- After: Boundary confirmed on July 30, 2026
Both boundary files were measured using the same geometry-based calculation method.
| Measurement | March 4, 2026 | July 30, 2026 | Change |
|---|---|---|---|
| Enclosed 3D coverage footprint | Approx. 55,922 km² | Approx. 61,867 km² | +5,945 km² |
| Boundary perimeter | Approx. 2,513 km | Approx. 2,768 km | +255 km |
| Area growth | — | — | Approx. 10.6% |
An increase of approximately 5,945 km² is not a minor local adjustment.
The expanded footprint is larger than many individual city-based 3D coverage zones and represents a major regional change.
Note: These figures represent the geographic footprint enclosed by the traced boundary. They are not land-only measurements and may include coastal water surfaces located inside the continuous coverage boundary.
How the 3D Coverage Area Was Measured
The boundaries were manually traced in Google Earth Pro by following the visible transition between photorealistic 3D surface imagery and conventional 2D satellite imagery.
The resulting boundary lines were saved as KMZ files.
For this comparison, each line was treated as a closed geographic boundary, allowing the enclosed footprint and total perimeter to be calculated directly from its coordinates.
This geometry-based method is more appropriate than estimating the area from perimeter length alone, especially because the New York coverage boundary is highly irregular and includes coastlines, narrow extensions and remaining 2D gaps.
For consistency, both the March and July boundaries were recalculated using the same method.
The figures should be treated as independent measurements by Global Map Insights rather than official Google coverage statistics.
Google provides an official coverage map for its Photorealistic 3D Maps platform, but it does not provide a detailed public change history for each individual Google Earth region.
▶ Google Photorealistic 3D Maps Coverage
The Largest Expansion Reaches Delaware and the Delmarva Peninsula
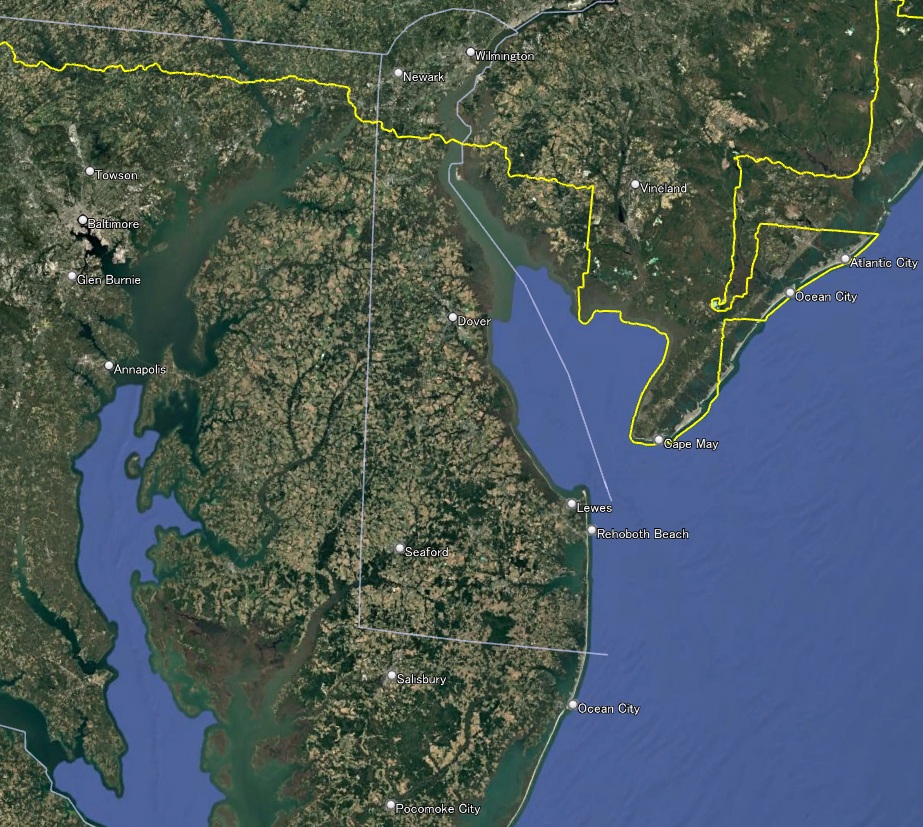
3D coverage around Delaware and the Delmarva Peninsula confirmed on March 4, 2026. The boundary had not yet reached Salisbury or Ocean City.
3D coverage around Delaware and the Delmarva Peninsula confirmed on March 4, 2026. The boundary had not yet reached Salisbury or Ocean City.
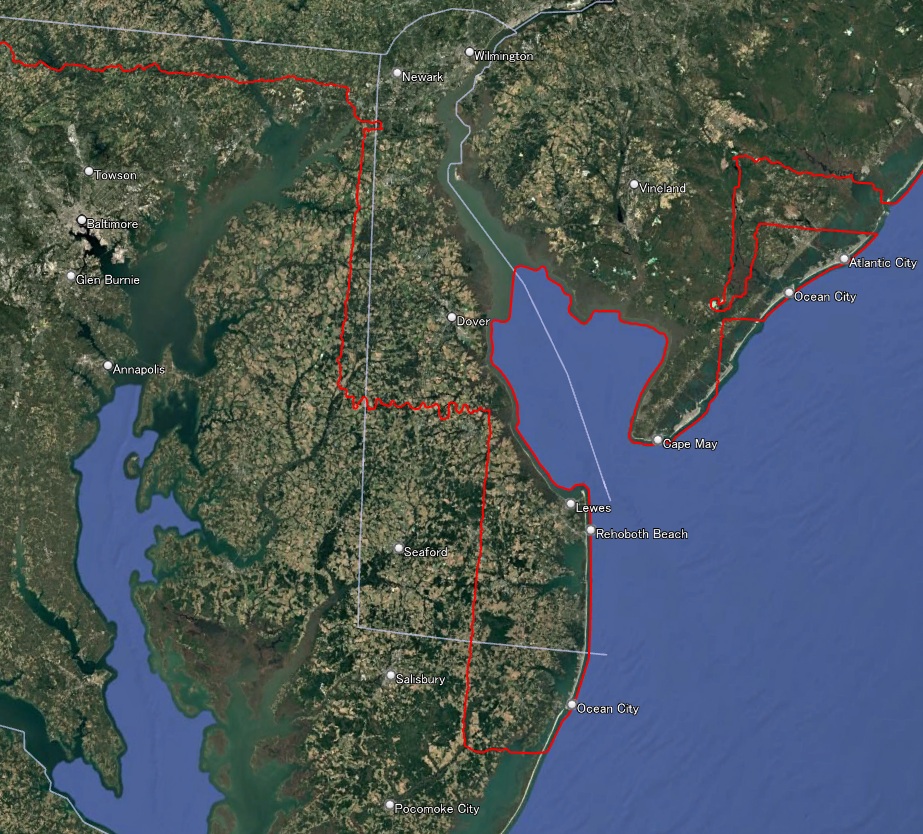
Expanded 3D coverage confirmed on July 30, 2026. The boundary now extends south through Delaware toward Salisbury and Ocean City, Maryland.
The largest newly added section has an enclosed geographic footprint of approximately 4,942 km².
In March 2026, the southern boundary crossed northern Delaware and then returned toward Delaware Bay and southern New Jersey.
Large parts of central and southern Delaware, as well as Maryland’s Eastern Shore, remained outside the continuous 3D region.
By July 30, the boundary had moved dramatically farther south.
The expanded coverage now extends through Delaware, passing areas around Dover and Seaford, before continuing into Maryland’s Eastern Shore toward Salisbury and Ocean City.
The new southern boundary reaches beyond Ocean City but remains north of the Pocomoke City area.
The southernmost point of the entire New York-centered coverage boundary moved from approximately 38.92° north to approximately 38.21° north.
This represents a southward extension of approximately 0.71 degrees of latitude.
The change demonstrates that Google Earth’s photorealistic 3D coverage is continuing to grow beyond major metropolitan centers and into smaller cities, coastal communities and rural areas.
Major Places Near the Delmarva Expansion
The enlarged map shows the new boundary extending through or near:
- Dover, Delaware
- Seaford, Delaware
- Lewes, Delaware
- Rehoboth Beach, Delaware
- Salisbury, Maryland
- Ocean City, Maryland
The boundary does not follow state or county borders.
Instead, it cuts across the peninsula according to the visible transition between Google Earth’s 3D and 2D imagery.
Southern New Jersey Gained Approximately 1,003 km² of 3D Coverage
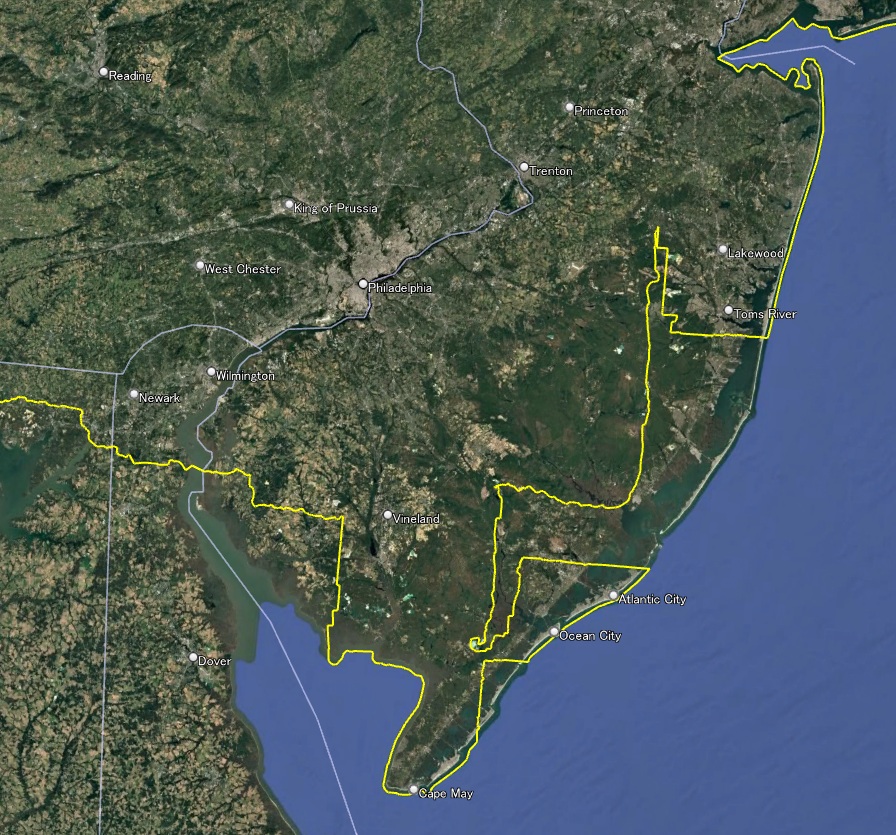
Southern New Jersey 3D coverage confirmed on March 4, 2026. A large gap remained between the inland boundary and the Atlantic coast.
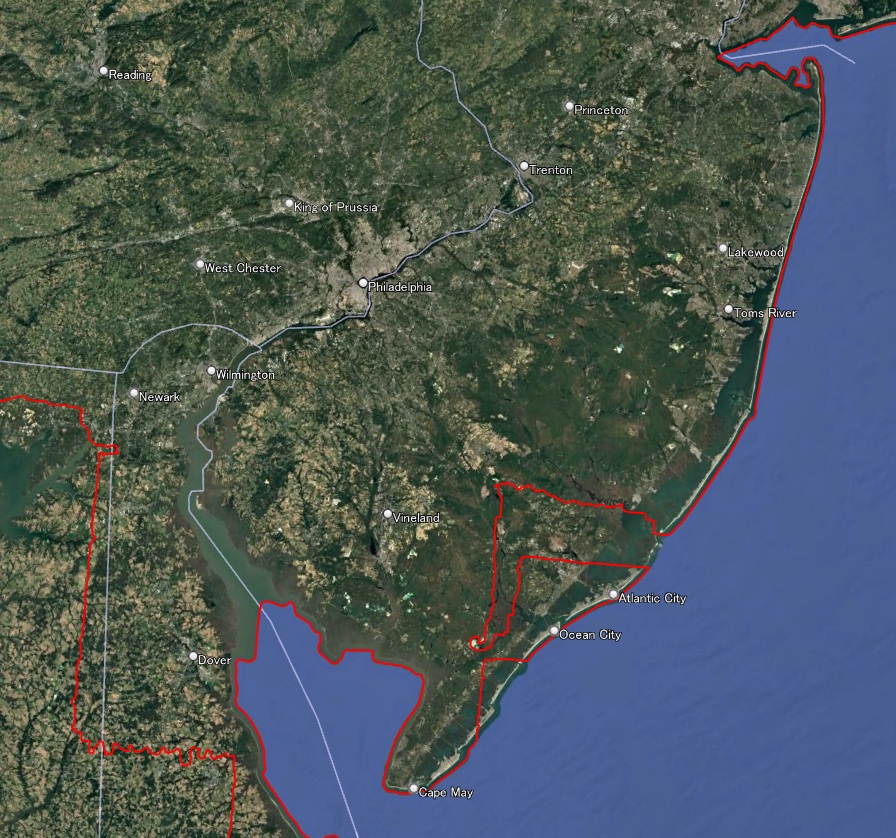
Southern New Jersey 3D coverage confirmed on July 30, 2026. Much of the previous coastal gap is now included.
A second major change occurred in southern New Jersey.
In March 2026, the 3D boundary turned inland around the Lakewood and Toms River area, leaving a large section between the interior boundary and the Atlantic coast outside the continuous 3D region.
The boundary then continued south through the interior of the state before returning toward Atlantic City and Cape May.
By July 30, much of this indentation had disappeared.
The new boundary follows the Atlantic side of New Jersey much more continuously from the Toms River area toward Atlantic City, incorporating a broad section that had previously remained in 2D.
Our comparison of the two KMZ geometries indicates that this newly connected section has an enclosed footprint of approximately 1,003 km².
The change is particularly noticeable around:
- Lakewood
- Toms River
- The inland area northwest of Atlantic City
- The coastal corridor between Toms River and Atlantic City
This is a clear example of a large gap being filled inside an already extensive regional 3D coverage zone.
Rather than simply pushing the entire outer boundary in one direction, the latest imagery also appears to have connected areas that were previously located immediately beside existing photorealistic 3D coverage.
Several Patch-Like 2D Gaps Have Disappeared
The expansion was not limited to the outer edge of the New York-centered coverage region.
Several smaller, patch-like areas that previously remained in 2D now appear to have been filled with photorealistic 3D imagery.
These gaps were surrounded, or almost surrounded, by existing 3D coverage.
Their conversion creates a more continuous viewing experience and simplifies parts of the boundary that were previously highly irregular.
This is important because Google Earth’s 3D expansion does not always occur only at the outer edge.
Updates can also fill gaps inside a much larger established coverage region.
A Large 2D Gap Still Remains Around Manorville on Long Island
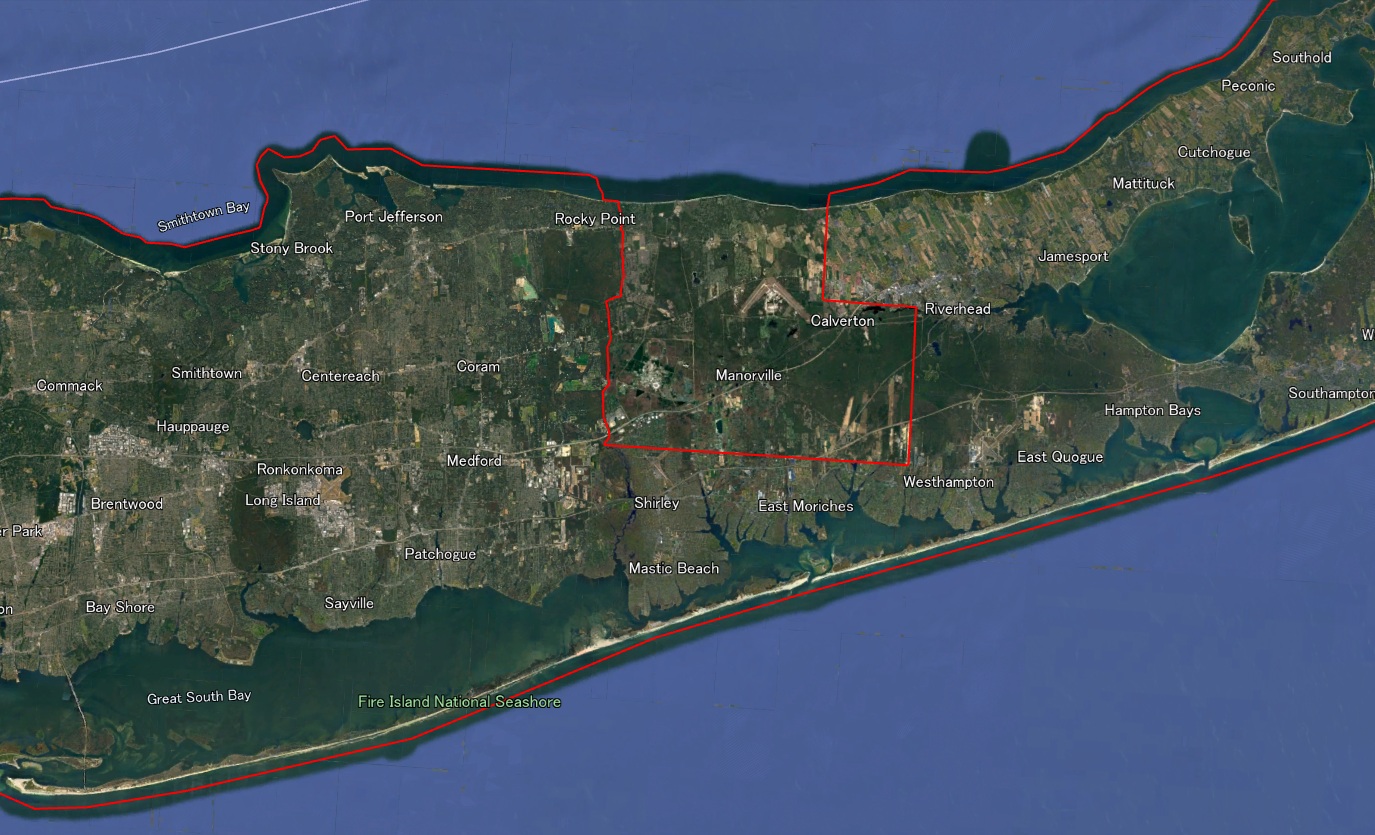
Despite the wider expansion, one particularly conspicuous 2D section remains in central Suffolk County on Long Island.
The remaining non-3D area is centered around Manorville and extends toward:
- Rocky Point
- Calverton
- The western side of Riverhead
- Manorville
- The area north of Shirley
- The northwestern side of Westhampton
Most of the surrounding region is displayed in photorealistic 3D, making this rectangular, cut-out-like section especially noticeable.
Similar patch-like gaps elsewhere were filled during the latest expansion.
For that reason, it would not have been surprising if this part of Long Island had also become available in 3D.
However, as of our July 30, 2026 observation, the Manorville area remains in conventional 2D imagery.
Why Does This Part of Long Island Remain in 2D?
Google has not publicly explained why this particular section remains outside its photorealistic 3D coverage.
The unusually straight and angular boundary may reflect the limits of aerial imagery collection, processing blocks or source data used to generate the 3D model.
However, this is only an inference based on the visible shape of the boundary.
It should not be interpreted as an official explanation from Google.
This remaining gap will be an important location to monitor during future Google Earth updates.
If it is eventually filled, the Long Island coverage boundary will become significantly more continuous.
Was the Entire New York Region Updated at the Same Time?
It is not possible to confirm that every newly detected area was released on the same day.
The two KMZ files show the difference between what was visible on March 4 and what was visible on July 30, 2026.
Therefore, the expansion occurred at some point—or through multiple updates—during that interval.
The comparison confirms the change in coverage, but it does not establish an exact release date.
For this reason, this article uses the expressions “confirmed on July 30” and “detected between March and July” rather than claiming that Google released the entire update on July 30.
Download the Updated New York 3D Coverage KMZ File
The updated boundary data used for this analysis is available as a free KMZ download.
By opening the file in Google Earth Pro, you can:
- View the complete July 30, 2026 boundary
- Examine the newly added areas
- Compare 3D and 2D imagery directly
- Locate the remaining Manorville gap on Long Island
- Use the boundary as a reference for future coverage changes
▶ Download the Updated New York 3D Coverage KMZ File (Free)
You can also browse our growing collection of free United States 3D coverage files.
▶ Free Google Earth 3D Coverage KMZ Downloads for the USA
How This Compares with Our Previous New York Survey
Our previous New York analysis examined the long-term growth of Google Earth’s 3D coverage from the fragmented city-based areas reported in 2017 to the enormous unified region visible in March 2026.
The latest comparison captures something different: a clearly measurable expansion within a period of less than five months.
The two articles document separate stages of development:
- 2017 to March 2026: Individual 3D city regions gradually became part of a vast continuous coverage area.
- March to July 2026: The continuous footprint expanded by another 5,945 km², mainly across southern New Jersey, Delaware and the Delmarva Peninsula.
The earlier article used a scale-based estimate for the total area.
For the present comparison, both the March and July boundaries were recalculated directly from the actual KMZ geometry. The geometry-based figures in this article therefore supersede the earlier scale-based estimate.
▶ Google Earth 3D New York: Full Coverage Map, Areas & Expansion Timeline
Google Earth 3D Coverage Is Becoming Regional, Not Just Urban
The latest expansion reinforces a pattern already visible around New York, Los Angeles and San Francisco.
Google Earth’s photorealistic 3D coverage is no longer limited to separate central-city models.
In some parts of the United States, it now forms enormous regional zones that cross city, county and state boundaries.
The New York-centered region extends far beyond Manhattan, Brooklyn and Queens.
It connects parts of New York, New Jersey, Pennsylvania, Connecticut, Delaware and Maryland within one broad and largely continuous coverage structure.
At the same time, the remaining Manorville gap shows that expansion is not always uniform.
Large outer areas may be added while conspicuous internal 2D sections remain unchanged.
This combination of rapid outward growth and selective gap filling makes the boundary especially valuable to document.
We Will Continue Monitoring the New York 3D Boundary
Between March 4 and July 30, 2026, the New York-centered Google Earth 3D coverage footprint increased from approximately 55,922 km² to approximately 61,867 km².
That represents an increase of approximately:
- 5,945 km² in enclosed geographic footprint
- 255 km in boundary length
- 10.6% in total coverage footprint
The largest expansion reached southward through Delaware and into Maryland’s Eastern Shore, while another major section was added in southern New Jersey.
Several smaller 2D gaps were also filled, but the large gap around Manorville in central Suffolk County remains.
Global Map Insights will continue comparing Google Earth’s 3D boundaries to identify future expansions, newly connected regions and remaining non-3D areas.
How far will this enormous East Coast 3D region expand next?
Related Google Earth 3D Coverage Articles
Sources and Notes
- Google Earth — Visual confirmation and manual tracing of the 3D/2D boundaries
- Google Photorealistic 3D Maps Coverage — Official general coverage information
- Global Map Insights KMZ boundary data confirmed on March 4 and July 30, 2026
- Area and perimeter figures calculated independently from the coordinates contained in the two KMZ files
Google Earth and Google Maps are trademarks of Google LLC. This website is not affiliated with or endorsed by Google. Boundary lines, measurements and interpretations in this article were independently created by Global Map Insights.

コメント